The following article is a joint publication by Josh Scott, a Subject Matter Expert in the field of economics, and me.
I’ve spent almost a decade now studying wide receiver play and route running in pursuit of trying to best evaluate the position.
Obsessing over trying to isolate wide receivers from outside variables was what gave birth to the idea for Reception Perception in a small apartment in Lynchburg, Virginia all the way back in 2013. I published the first RP articles on my own site Backyard Banter in the summer of 2014 and began collecting league-wide during that season. In the years since I’ve charted over 400 NFL and college players, and almost 100,000 routes (I checked) while creating unique receiver data that I believe accomplishes the original goal of filtering outside variables from the evaluation.
Through all that studying there have always been questions – both from myself and readers – about what Reception Perception really is telling us, why it matters and how can we apply it.
With eight years worth of historic Reception Perception NFL data I think we are in a more than comfortable position to answer some of those questions. To do that, I enlisted the help of someone much smarter than me in working with data science and application, Josh Scott, a current Reception Perception subscriber. Josh offered to dive deep into the historic database in an attempt to quantify relationships between some of the main RP metrics and traditional NFL stats and publish a study on his findings.
Here’s a little about Josh…
Josh Scott is a Subject Matter Expert in the field of economics. He currently teaches college-level courses in microeconomics and macroeconomics, and also helps create and edit assessment tools for textbook publishers. Josh has received Masters Degrees in Economics from the University of Southern California and Louisiana State University and is currently completing his dissertation for his doctorate at LSU.
This article is a collaborative effort between myself and Josh, so going forward anything that’s cited directly from his study will be in italics (our initials will also precede our blurbs). If you want to just read Josh’s work without my commentary, you can download “RP Analysis: Assessing the Effect of Success Rates Versus Coverage and Alignment on Statistical Production” below.
If you really don’t want to do a ton of reading (you should) then scroll all the way to the bottom for our combined major takeaways in the summary.
I believe at the end of this, you’ll be as excited about the conclusions as I was and feel a similar sense of validation toward the Reception Perception process. We won’t wait any longer: Let’s dive right into Josh’s findings.
Introduction
JS: This analysis is part of a new series of Reception Perception articles that applies statistical methods and inference in order to quantify relationships between RP data and particular outcomes of interest. The series aims to expand on and answer questions regarding “how much” we should weigh what we observe on the field and in RP data.
This particular investigation aims to assess how changes in success rates against defensive coverages affect outcomes such as fantasy points per game, a measurement of consistent fantasy points per game, yards per game and receptions per game. This investigation is further expanded to see whether these relationships change based on whether a player lines up outside or in the slot.
Data
The explanatory variables of interest all come from the Reception Perception NFL Database. The RP NFL database features over 360 individual seasons from wide receivers of all ages and types.
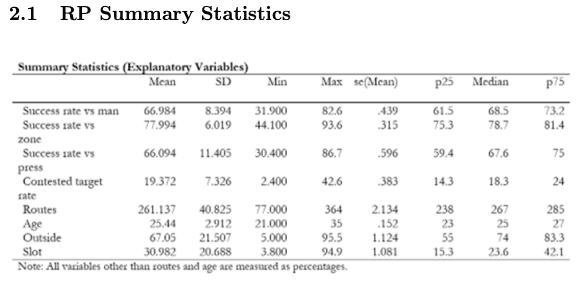
The database features success rates versus various coverage types, success rates by route, alignment percentages, route percentages, target data and “in-space” data for each featured player for that respective year. A key feature of this data set is the repeated observations of many players over the life of the data set, which allows for cleaner analysis of relationships. The table below reports descriptive statistics of the main variables included as explanatory variables in estimation.
MH: Josh tested the above Reception Perception data against four “outcomes of interest” that we decided would best represent a mix of wide receiver skill and fantasy football value.
Those outcomes of interest were:
- PPR fantasy points per game (fptsg)
- True fantasy points per game (trueptsg)
- Receptions per game (rg)
- Yards per game (yg)
JS: The fantasy point metrics were calculated for a PPR format, and yards per game and receptions per game allow us to further dissect how players are scoring their points.
In addition, RP is first and foremost a WR evaluation tool, so it is important to assess these traditional outcomes. True fantasy points per game is calculated to factor in the commentary that touchdowns and fumbles are not necessarily “sticky” on a year-to-year basis. Thus, true points per game is calculated without those two methods of fantasy scoring. It can be viewed as a composite of yards per game and receptions per game. We can also refer to this metric as consistent fantasy points per game.
The following table reports descriptive statistics for the outcomes of interest we wish to investigate.
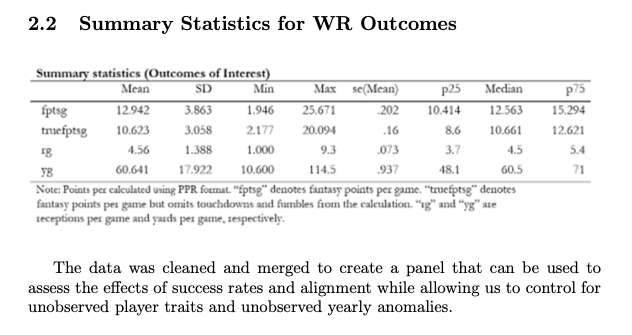
The data was cleaned and merged to create a panel that can be used to assess the effects of success rates and alignment while allowing us to control for unobserved player traits and unobserved yearly anomalies.
Method and Model
JS: Armed with panel data on WRs, I implemented Multi-Way and Two-Way Fixed Effects models when running regression analysis. As mentioned, this data and model type allows for cleaner relationships between success rates versus coverages and outcomes of interest. These relationships will be less obscured by factors such as a one-year boost in scoring, unobserved changes in officiating, and unobserved player traits.
MH: If you want an in-depth breakdown of the equation Josh used, just scroll back up and download his full study. He goes on to explain the goal of each equation and what we were seeking to find…
JS: The results will give us a “rule of thumb” that can help us weigh the results from a particular player profile.
In other words: how much is a one percentage point increase in man coverage worth, and how much is it worth relative to a one percentage point increase in success rate versus zone? Are these increases worth the same, or is one relatively more important than the other?
The next step is to expand upon the baseline equation to account for differences in the relationships based on player alignment. While the baseline equation gives a general rule/relationship, it is important to explore whether lining up outside or in the slot affects the importance of each success rate. In particular, is success versus man or zone more important to a particular alignment, and how important is it?
Results
Table 1 shows the baseline results of this analysis. Each column shows the relationship between the explanatory variables and one of the five different outcome variables.
The first four columns are of focus.
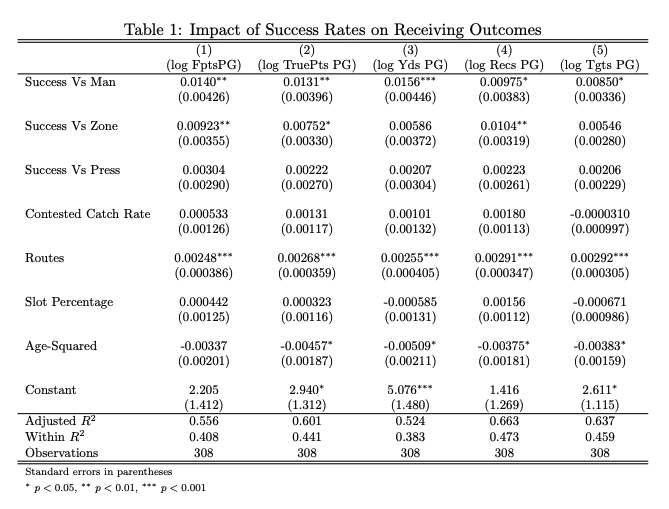
JS: Column 1 shows the relationship between fantasy points per game and the explanatory variables of interest. Recall that taking the log of the dependent variable allows us to assess the effects in terms of percentage change.
The coefficient for success rate versus man coverage indicates that a one percentage point increase in success rate versus man coverage is correlated with a 1.4% increase in fantasy points per game, on average. Meanwhile, the coefficient for success rate versus zone coverage indicates that a one percentage point increase in success rate versus zone is correlated with a 0.92% increase in fantasy points per game, on average.
Both coefficients are highly statistically significant.
Moving to column 2 will factor out fantasy points that are deemed “not sticky” from year to year, such as touchdowns and fumbles. Thus, the coefficients on our explanatory variables in this column could be deemed as the consistent fantasy points we should expect per game on average.
Here, we see that a one percentage point increase in success rate versus man coverage is correlated with a 1.31% increase in consistent fantasy points per game, on average.
For zone, a one percentage point increase in success rate versus zone is correlated with a 0.75% increase in consistent fantasy points per game, on average. Again, both coefficients are highly statistically significant.
Columns 1 and 2 both give us a key insight: In general, a one percentage point increase in success rate versus man coverage (ex: from 66% to 67%) is worth approximately 1.5 to 1.75 times the value (or 50 to 75% more) of the same increase in success rate versus zone.
MH: For years, I have held the belief that “success rate vs. man coverage” was Reception Perception’s most powerful metric.
It was the driving force behind predicting breakouts in the early days like Allen Robinson, Stefon Diggs, Tyler Lockett, etc. Anecdotally some of the consensus best receivers in football consistently finish among the league leaders in this metric. From a pure scouting perspective, having a player who can win one-on-one matchups in man coverage is typically thought to be more valuable. That’s backed up by the fact the league average success rate vs. man in Reception Perception is 10% lower than the success rate vs. zone.
I feel that Josh’s findings back up that belief. Receivers who clear a 70% success rate vs. man coverage mark will continue to be highly regarded going forward.
JS: Columns 3 and 4 also yield interesting results. An increase in success rate versus man coverage will yield a substantially larger percent increase in yards per game on average, while we can expect an increase in either success rate to yield similar increases in receptions per game.
While many use Reception Perception as a tool for fantasy football, RP is first and foremost a tool for evaluating wide receivers. Column 2 is essentially a composite of columns 3 and 4, which show the impact of our explanatory variables on receiving yards per game and receptions per game.
Column 3 shows that a one percentage point increase in success rate versus man coverage is correlated with a 1.56 percent increase in reception yards per game, on average. This is almost one full percentage point higher and at least 2.5 times larger than the effect of a one percentage point increase in success rate versus zone coverage on yards per game. Meanwhile, a one percentage point increase in success rate versus man or zone coverage leads to roughly a 1% increase in receptions per game
Column 5 is included as a baseline test of what contributed to increased targets. We can conclude that, in addition to running routes, success rate versus man coverage contributes to a statistically significant increase in targets. Success rate versus zone coverage does contribute to an increase in targets, but is not as precisely estimated and is statistically significant at p = 0.053
MH: The phrase “targets are earned,” has finally crept its way into the football discourse. Josh’s analysis of Reception Perception data confirms that getting open leads to more volume and from that volume, comes a trickle-down of production.
Obviously, the primary goal of RP is to isolate the individual receiver and evaluate them on their ability. But it’s still good to know that the RP metrics do foreshadow a growth in production.
Going forward, we can more confidently predict our man coverage-beaters to experience a breakout season during their careers.
Results: Success Rates and Alignment
MH: This next part of Josh’s study might be even more important. Over the last few years, I’ve placed more importance than ever on alignment as a starting point for every receiver evaluation. Josh tested just how important that was in this next section.
JS: Our next question of interest is: do these results and relative weights change depending on the percent of the time you spend in a particular alignment. To investigate this, We utilize various forms of equation 2, and then we look at how the relationships change when holding alignments at particular percentages.
For example, how does the relationship between success rate versus man coverage and true fantasy points per game change if a player lines up outside 55% of the time? What about 60, 65, or 70%, etc? This same relationship also conveys the relationship when 6 the receiver lines up in the slot at lower percentages. We can also substitute in success rate versus zone and investigate a similar question. The tables that follow investigate the relationship between true/consistent points per game and man/zone success rates when receivers are lined up on the outside.
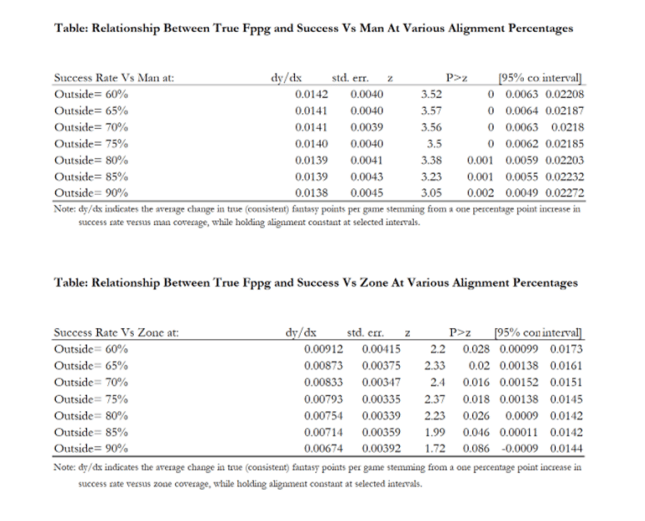
JS: The first table shows the relationship between true points per game and success rate versus man coverage while holding alignment constant (at percentages aligned outside).
What is evident from this first table is the consistent nature of the relationship regardless of how often a player lines up outside. A one percentage point increase in success rate versus man coverage generates approximately a 1.4 percent increase in consistent fantasy points per game, on average.
Meanwhile, the second table shows the relationship between true points per game and success rate versus zone coverage while holding alignment constant. Here, zone is less important if lining up outside. The importance of zone success seems to decline the more a player lines up outside.
MH: If you’re going to line up as an outside receiver, you have to be able to win against man coverage. That much is clear with very few expectations.
While outside receivers don’t have to be the greatest performers in success rate vs. zone coverage, it can still be a solid indicator. However, Josh’s research finds that success rate vs. zone coverage is essential for slot receivers.
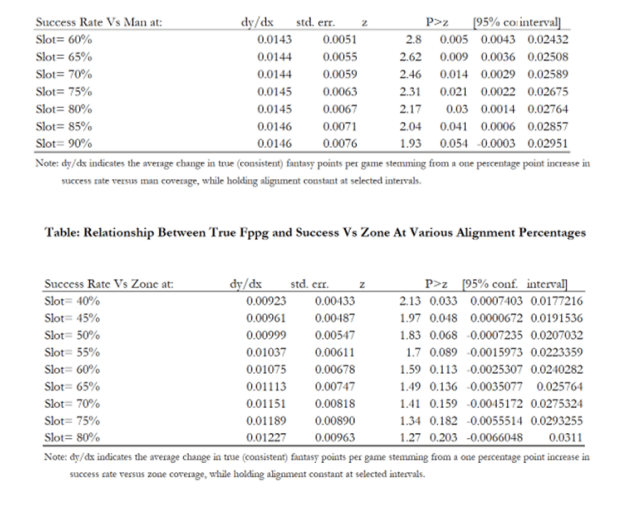
JS: The first slot alignment table shows the relationship between true points per game and success rate versus man coverage. It is remarkable how consistently important success rate versus man coverage is, regardless of where a player lines up.
A one percentage point increase in success rate versus man coverage generates approximately a 1.42 percent increase in consistent fantasy points per game, on average. Regardless of what percentage a player spends inside or outside, these results stay consistent and statistically significant.
An equally important result is found in the second slot alignment table. Here, we see that the importance of success rate versus zone grows the more a player lines up in the slot. This is important to see, and increasingly puts what we have seen from 2021 into context.
The more a player plays in the slot, the higher the effect of a one-percentage-point increase in success versus zone on consistent fantasy points per game. We also see a convergence in the effects of success versus man and zone.
When looking at the full range of alignment from outside = 90% (which implies slot ≈ 10%) to slot = 80% shows the coefficient changes from approximately 0.675% to 1.23%, which is a large fluctuation. While these estimates are less precisely estimated due to a lower number of slot receivers compared to outside receivers, the picture we have seen the last few years is more clearly painted.
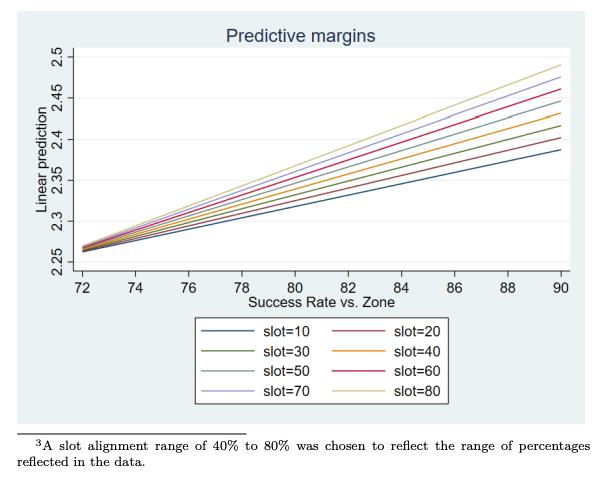
Combining high success rates versus zone with high slot alignments magnifies the effects, as seen in the chart below. Each line reflects the coefficients of the previous tables of zone success, but for the different slot percentages. The x-axis measures strength of zone success, and the y-axis is the predicted log of true fppg. Exponentiation gives us a range of 9.5 to 12.25 points per game (just from these aspects).
MH: Here Josh helps confirm what I’ve been wondering for quite sometime now. If a receiver sees more time in the slot, the more important their success rate vs. zone coverage becomes.
Players who win from nontraditional X-receiver roles are going to run more routes against zone coverage. So a receiver of this archetype having a high success rate vs. zone coverage should be valued just as highly as an outside receiver with a strong success rate vs. man coverage score.
Not giving those players their due has been a failing of mine the last few years. Despite what my own data was telling me!
Cooper Kupp has been the NFL’s best zone-beater for years now and we all know how that story ended last season. A guy like Amon-Ra St. Brown doesn’t win in the same ways some of the other highly drafted 2021 rookies do but he looks like the next guy in this archetype of player. These guys need to be boosted just as highly as the receivers who beat man and press on a routine basis.
Summary
JS: This analysis explores the relationship between success rates versus different coverages and important outcomes of interest.
In general, we find that a one percentage point increase in success rate versus man coverage (ex: from 66% to 67%) is worth approximately 1.5 to 1.75 times (or 50 to 75% more) the value of the same increase in success rate versus zone. This can be used as a great rule of thumb when reading through profiles.
Additionally, the difference in yards per game resulting from an increase in success rates is a large driver of the differences. We also find that the relationship between success rate versus man coverage and both fantasy points per game measures is remarkably consistent regardless of where a player lines up.
Success rate versus man coverage is confirmed to be the principal and consistent driver of important receiver outcomes (other than being on the field). What is equally important in this study is what we find with regard to success rate versus zone. In contrast to success rate versus man coverage, the importance of success rate versus zone coverage is highly dependent on alignment inside or outside.
When looking at the full range, from being a pure outside receiver to being a majority slot player, the coefficient changes drastically (practically doubles in magnitude). Thus, we should not disregard success versus zone. Instead, we should weigh it heavier when the player lines up inside more or gets lined up all over the field in order to exploit coverages. Players like Deebo and Kupp are evidence of this. Success rates matter, but the key to truly understanding a player is understanding these rates in conjunction with alignment.
MH: Well I certainly feel like the last decade of my life hasn’t been completely useless.
Coming out of this study here are my five main takeaways:
- Success rate vs. man coverage matters and remains the most important metric in Reception Perception. Players who start to push north of 70% success rate vs. man coverage are really good future bets. The higher they rise, the more confident be should be in their future projection. Using alignment combined with the historical success rate vs. man percentiles, the findings of this study only increases our confidence in projecting future breakouts with RP data.
- Success rate vs. man coverage is more important for outside receivers. While success rate vs. zone is not as important for outside receivers, it does still matter. I view the “elite tier” or wide receivers as those who clear 75% success rate vs. man, 80% success rate vs. zone and 80% success rate vs. press. If you look through the historical data tables I think you’ll agree.
- The more guys play inside or off the line of scrimmage, the more important their success rate vs. zone coverage becomes. This is a new and evolving archetype of wide receiver, especially as teams line up bigger players inside. We should try to remain ahead of the curve in valuing these players just as highly as great success rate vs. man coverage performers.
- Teams should line up their top receiver in the slot more often. Even if they’re a man coverage-beater, Josh’s work shows us that that metric still matters for interior players. We also know that the league-wide average for success rate vs. zone is over 10% higher than success rate vs. man. Teams can get their great players easier looks by lining up inside.
- Reception Perception is good and I’m more confident than ever that it is the best method for wide receiver evaluation. I’m glad to have dedicated my life to being at the forefront of studying this position.
