Quarterback may very well be the most complicated position in pro sports. Football in general is a difficult game to quantify in simple terms and quarterbacks take that challenge to the extreme.
So much of what they end up producing statistically is context dependent. Think offensive line play, wide receiver quality, play calling, etc.
That’s why two quarterbacks could finish a season with the same QBR or yards per attempt or whatever metric you want to throw out and you, my football-savvy reader, already know they most likely arrived there by completely different means.
Where were their targets distributed? How often were they pressured? How many of their throws were into tight windows? How much did their pass-catchers hurt or help them? That’s where charting comes in. Hopefully, me scouring their game tape will illuminate some context and work towards a deeper understanding of each quarterback.
Player charting profiles will consist of eight games (or as many as a player has, if fewer than that). As a general rule, each player will have four home games and four away games, and will have at least one game versus each of their three divisional opponents.
The Data
There’s a ton of different data sets to be covered and explained in the charting. A stat like yards per attempt is pretty straightforward and easy to understand. Success rate by route? Well, maybe not so much. That’s why I thought it would be good to lay out some more in-depth definitions here.
Simple Accuracy Measures
Target Rate and Success Rate By Yard Range — A simple measure of how often and how accurately a quarterback throws into incremental five-yard ranges, starting with 0 (at or behind the line of scrimmage) and working up to 20+ yards downfield.
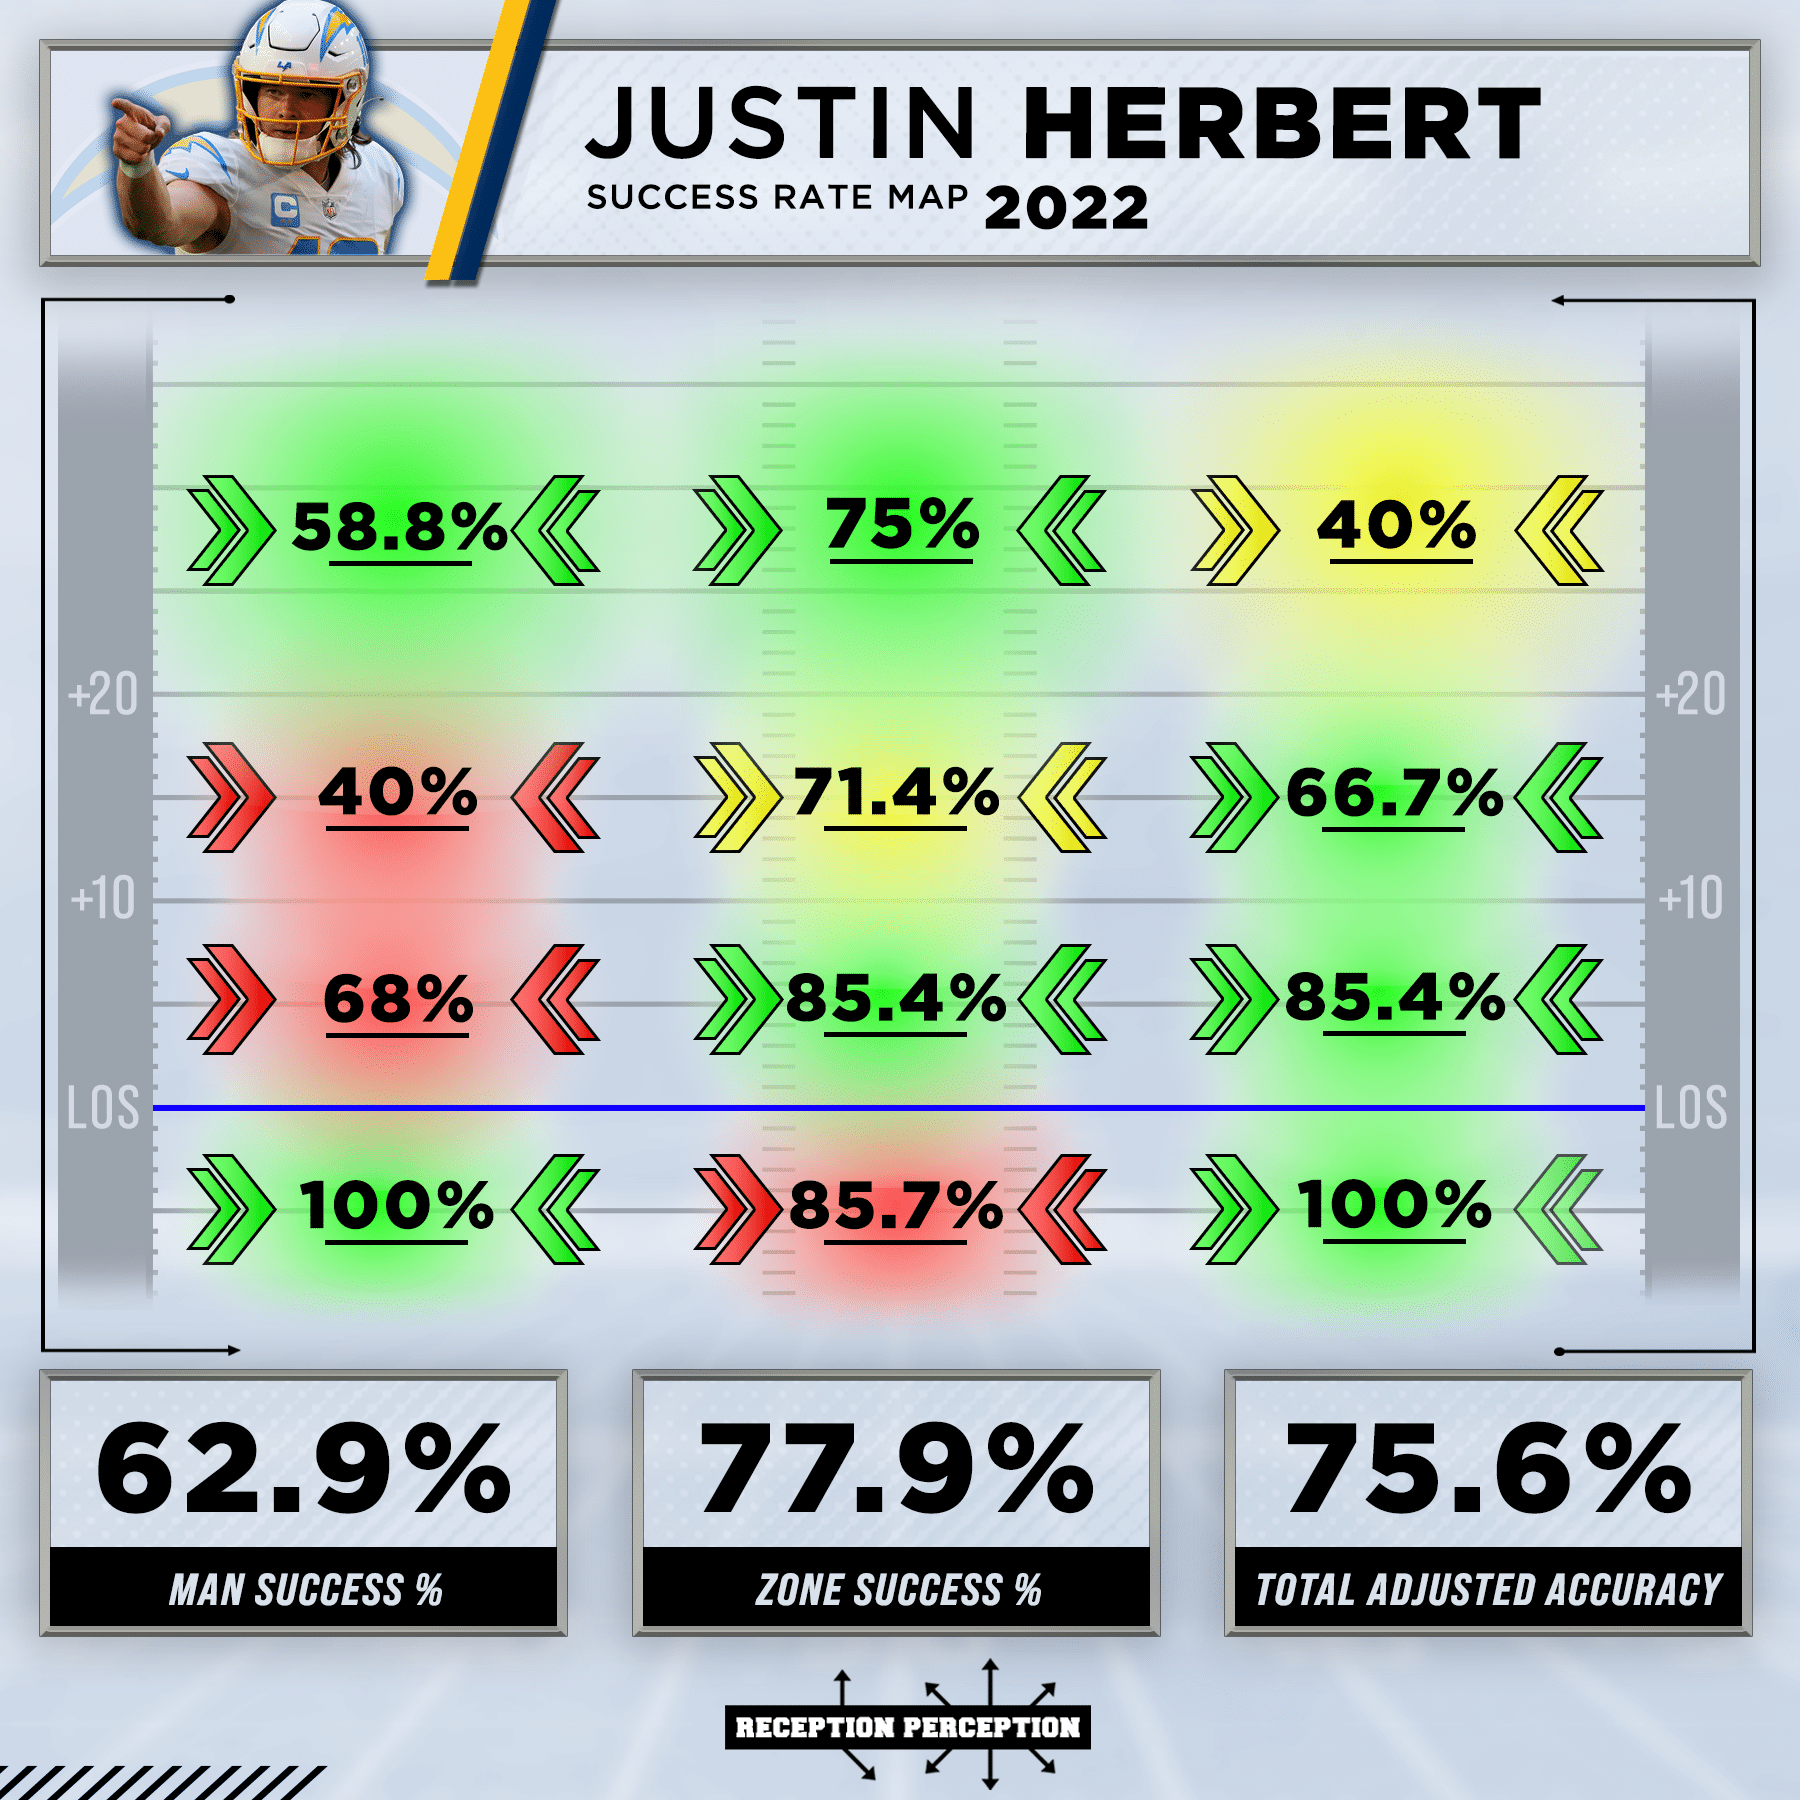
Success Rate by Direction/Range — A similar stat, this measures a quarterback’s accuracy to each third of the field (left, middle, right). For the sake of visual clarity, this stat is broken into 10-yard ranges rather than five, but still serves to identify general buckets of the field where a quarterback shines or struggles.
Overall Adjusted Accuracy — Adjusted accuracy score that slightly scales by yardage ranges. Below is the point scaling for accurate throws, with 1 being the standard, which is then divided by total throws.
- 0 yards (at or behind LOS): 0.8
- 1-10 yards: 1
- 11-15 yards: 1.1
- 16-20 yards: 1.2
- 20+ yards: 1.3
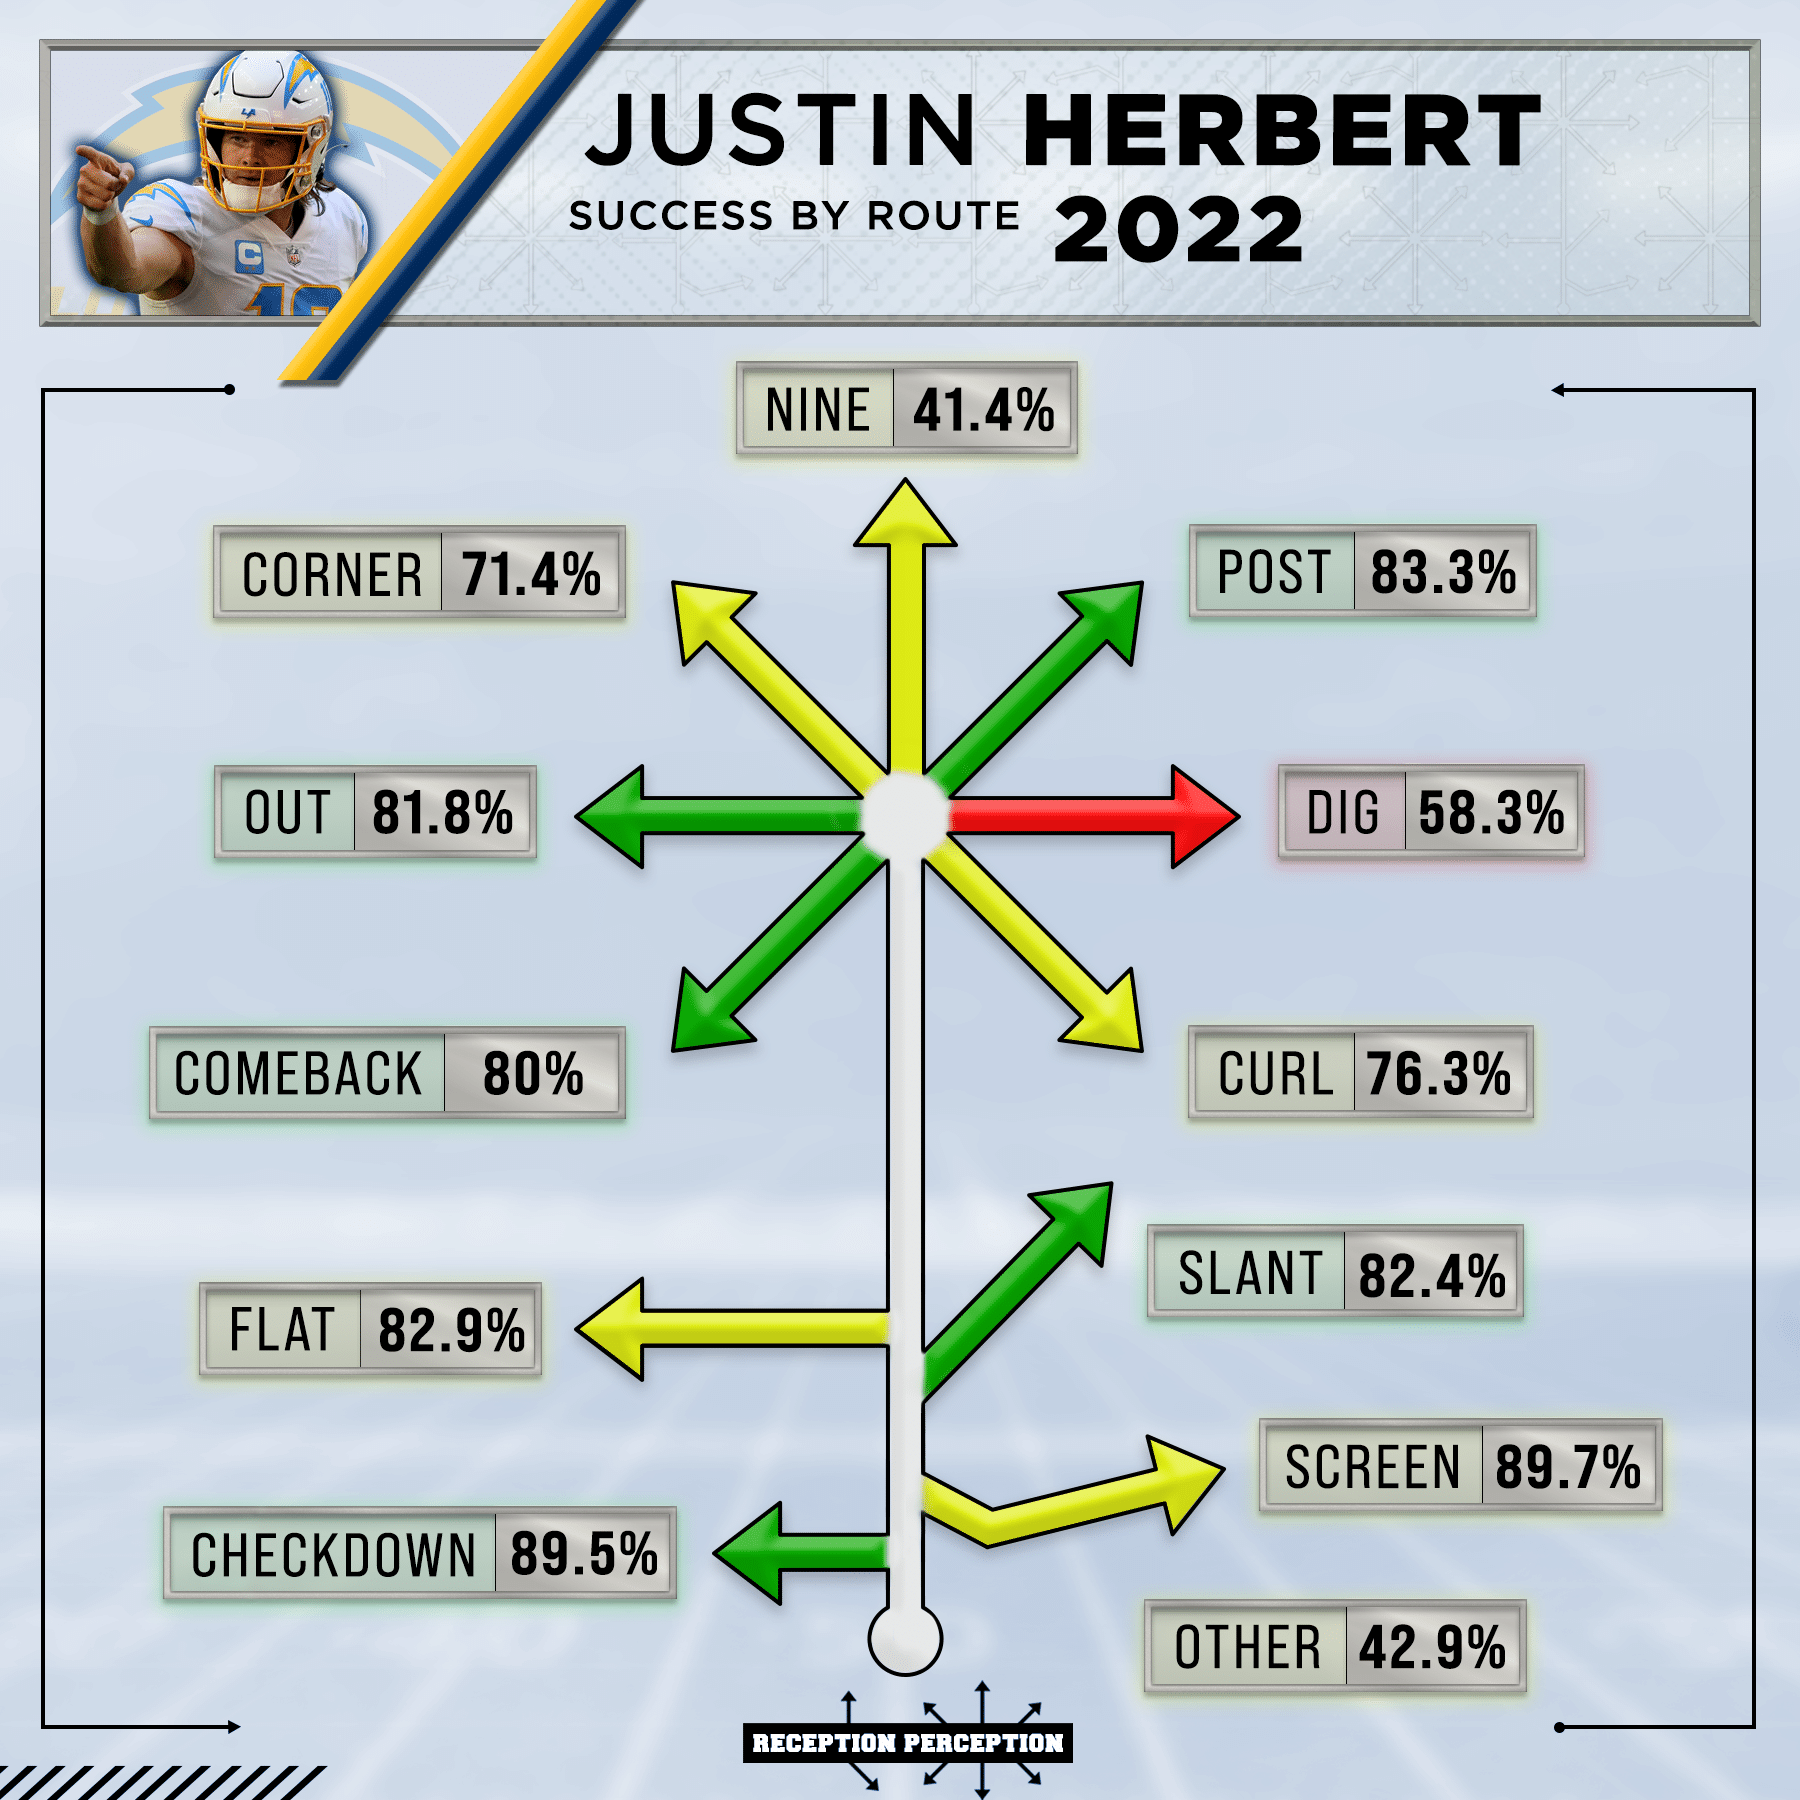
Target Rate and Success Rate By Route — Piggybacking off of Matt Harmon’s work with wide receivers, this is a measure of which route types quarterbacks throw and how accurate they are on those routes. A few tweaks and additions have been made to fit the full offensive route tree, rather than just wide receivers, but the goal is to keep the buckets similar. Below is a list of each route type and, additionally, an explanation of what kinds of routes fall into that bucket if necessary.
- Checkdown (CHK): Short throws made late in the down that are not part of the designed progression of the play and meant to be a last-resort, often to running backs and tight ends.
- Comeback (CBK)
- Corner (CNR)
- Curl (CRL): Hitches, curls, spot routes, and deep stop routes all fit into this bucket.
- Dig (DIG)
- Flat (FLT)
- Out (OUT)
- Post (PST): In addition to typical post routes, seam routes and deep overs have been included, as they both also target the deeper middle portions of the field.
- Screen (SCR)
- Slant (SLT): In addition to standard slant routes, drag routes, short crossers, and the occasional angle route have been added to this bucket.
- Nine (NIN): Pure vertical routes, typically outside the numbers. Wheel routes and fades are included in this group.
- Other (OTH): This is a catch-all for scramble plays in which the integrity of the initial route has been completely broken and unchartable in another bucket.
- Throw Away (TA)
- NOTE: Jet and shovel passes are not included in the charting numbers. I do not view them as passing plays that say anything about a QB one way or the other.
Coverage-Based Stats
For the purposes of singling out useful data, all screen pass attempts are pulled from this data set. Charting coverage for screen passes tells us nothing and just about every screen pass would go into the “open” category, which just muddies the data.
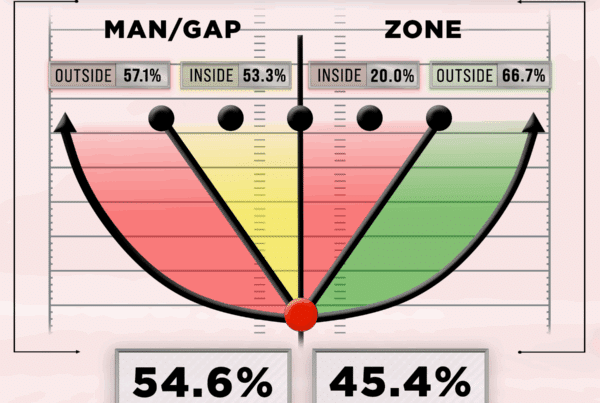
Man Coverage Target Rate and Accuracy
Zone Coverage Target Rate and Accuracy
Tight Window Target Rate and Accuracy
Open Window Target Rate and Accuracy
Target-Based Data
WR Adjustment (ADJ): A target in which the ball location forced a receiver to make an adjustment that should not have been necessary. QBs are penalized slightly in Adjusted Accuracy scoring for such throws.
Contested/Catchable Drop (CDP): A drop in which QB and WR can share the blame for a drop. Maybe the catch point was slightly contested, or maybe the ball was a little off-target and the WR couldn’t quite bring it in.
Blatant Drop (BDP): A drop in which the pass-catcher is purely at fault for a dropped pass.
Pass Defended (PD): A throw in which the WR had no real shot at the ball and a defender broke it up.
Situational/Contextual Data
Pressure Rate and Success Rate Under Pressure
Play-Action Rate and Success Rate
RPO Rate and Success Rate
Out of the Pocket Rate and Success Rate
3rd/4th Down Success Rate and Conversion Rate
Red Zone Success Rate
Final Notes
It’s worth making clear that this is a brand new project, at least as it pertains to the NFL. I have done college charting dating back to the 2016 draft class, but this is the first time I’m wading into NFL waters. It’s also the first time Reception Perception will be offering QB charting data.
As such, the color-coded success rates and general ranges for percentiles will fluctuate as we add more quarterbacks to the database.
But other than that, let’s get after it. I couldn’t be more excited to be working on this project. To me NFL quarterbacking is the pinnacle of professional sports and I’m thrilled to be able to dig in deeper than I ever have before.
Thank you all for following along!